
From Data to Action: WasteMAP’s New Features Empower Localized Methane Mitigation
WasteMAP (Waste Methane Assessment Platform), RMI’s open-access web platform designed to support transparent, data-driven methane mitigation in the waste sector, is getting an upgrade and rolling out several new features as part of a site-wide update.
As methane — a greenhouse gas over 80 times more potent than CO₂ in the short term — continues to rise on the climate agenda, cities and countries are increasingly seeking ways to tackle methane from waste. WasteMAP equips decision makers with tools and strategies to accelerate methane mitigation in alignment with broader national climate goals. Our latest updates make it easier to quantify, simulate, and drive actions on methane emissions at the individual site level.
Join us for a live demonstration during our upcoming webinar on July 10th.
What’s new on WasteMAP
- Site-Level Decision Support Tool (SDST)
Following the successful release of the City-Level Decision Support Tool (CDST) at COP 28 in 2023, we’re now introducing the Site-Level Decision Support Tool (SDST). This new feature enables users to estimate how operational changes at specific waste disposal sites — landfills or dumpsites — can mitigate methane emissions.
With SDST, users can:
- Input site-specific data, such as incoming waste amount and waste composition
- Estimate baseline methane emissions of the disposal sites
- Simulate various interventions, including:
- Installation of gas collection and control systems (GCCS)
- Use of biocovers
- Enhancing gas capture and flaring efficiency
- Closure of dumpsites or landfills
Case Study: Olusosun dumpsite decommissioning – Lagos, Nigeria
As a member of the LOW-M (Lowering Organic Waste Methane) initiative, Lagos has committed to decommissioning five major dumpsites, including Olusosun dumpsite, the largest in the country. RMI’s WasteMAP team has collaborated with Lagos Waste Management Authority (LAWMA) to advance its methane emissions reduction goals by identifying regulatory barriers, providing policy recommendations, fostering peer-to-peer learning among waste officials, and promoting waste management best practices.
As shown in Exhibit 1, WasteMAP’s SDST allows us to estimate the significant methane reduction potential of decommissioning the Olusosun dumpsite, one of the largest in the region. Decommissioning the site by 2027, as planned by LAWMA, could cut associated methane emissions by 40 percent, from a baseline of approximately 17,100 tons per year to just 10,300 tons per year by 2030.
Exhibit 1. A screenshot from WasteMAP showing the methane mitigation potential of Olusosun dumpsite decommissioning in 2027 as estimated by WasteMAP’s SDST (blue curve showing the dumpsite decommissioning scenario; the orange curve is business as usual; the star represents an annualized methane emission rate estimated from the plume observations of the GHGSat satellite from October 2023 to September 2024 through SRON’s TWOS Initiative).
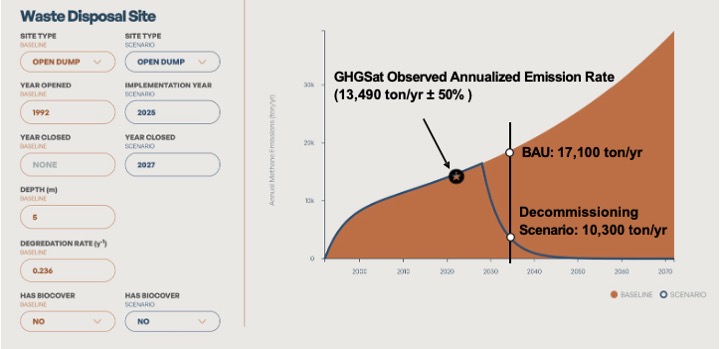
Source: WasteMAP SDST, captured June 2025
- User accounts for scenario management
We’ve also introduced login functionality, allowing users to create accounts and save their SDST scenarios (Exhibit 2). Now, users can:
- Save multiple site scenarios on their personal dashboard
- Revisit, edit, or delete any saved scenarios
- Track and refine mitigation strategies over time
If you’d like to help improve baseline estimates, we encourage you to select “Yes” in the Share Data dropdown to share waste data with RMI. The WasteMAP team will contact you about the use of the waste data on our platform.
Exhibit 2. User dashboard for accessing saved scenarios
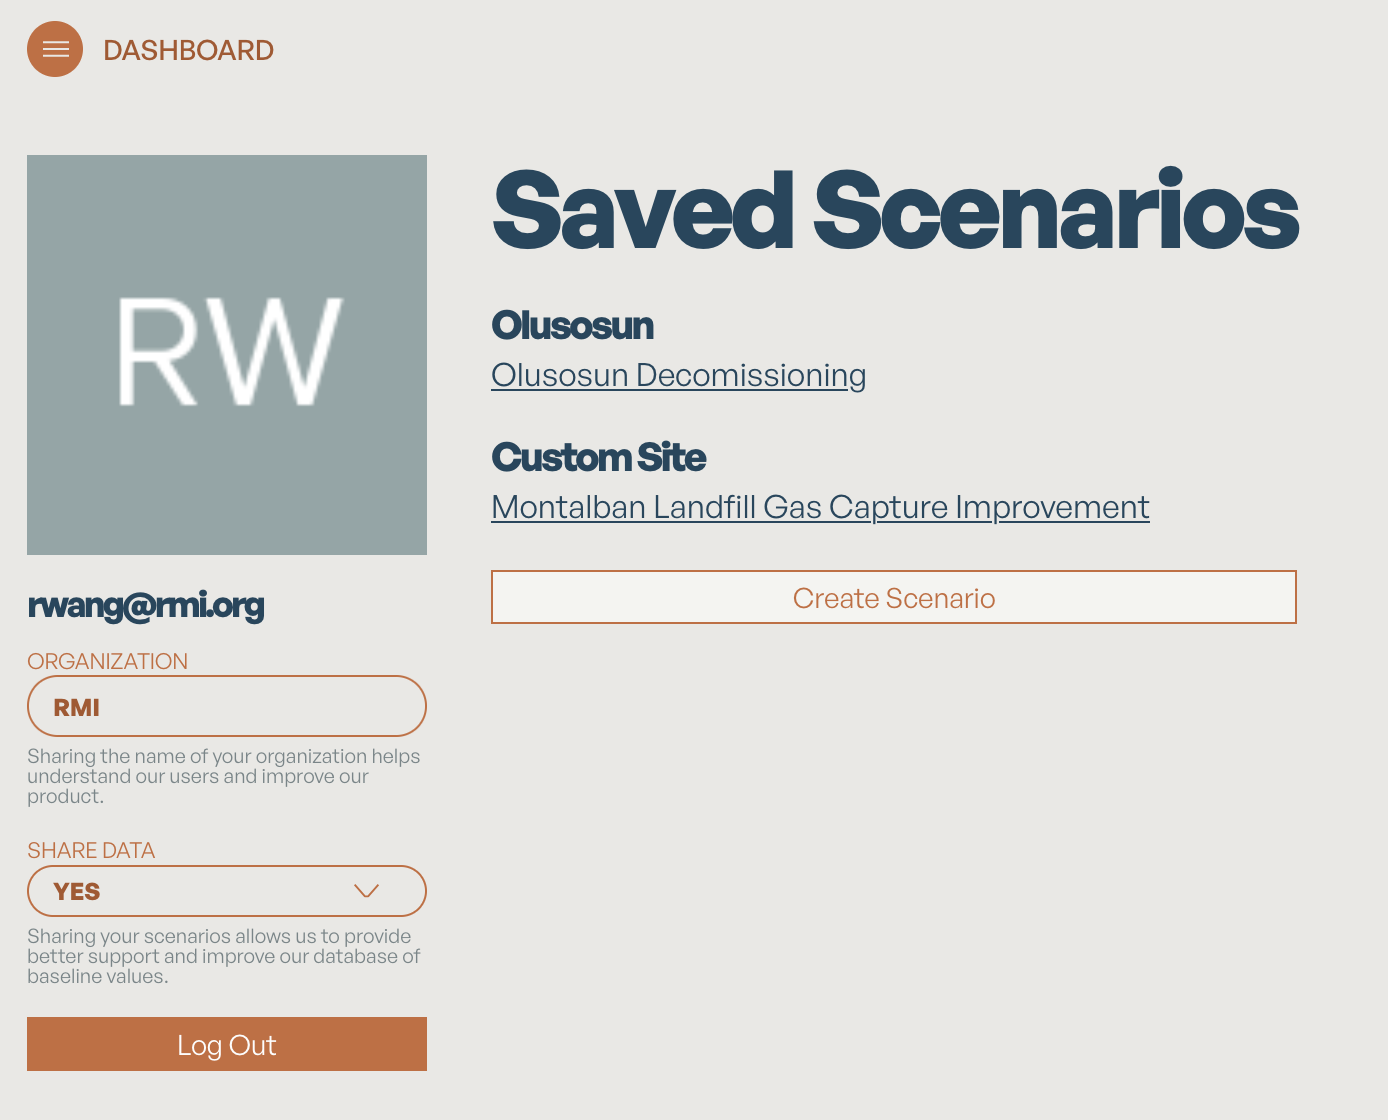
Source: WasteMAP, captured June 2025
- Improved City-Level Decision Support Tool (CDST)
We’ve made significant improvements to the CDST based on feedback from partners and users:
- Added a Food Waste Prevention slider to estimate the impact of upstream mitigation. Food waste decays faster than any other material at disposal sites, making it the leading source of landfill methane emissions. Preventing food waste is one of the most effective ways to cut these emissions, as it avoids methane generation at the source. It also extends the lifespan of disposal sites and brings other benefits, such as improving local food security through redistribution programs. This has become a growing priority for many municipalities. For example, Rio de Janeiro — a LOW-M participating jurisdiction — has a goal of reducing food loss and waste by 50 percent by 2030 as part of its plan for sustainable development and climate action. Using the newly added Food Waste Prevention slider on WasteMAP, we can show that significant methane mitigation can be achieved for Rio with a 50 percent reduction in food waste by 2030 (Exhibit 3).
- Introduced more granular modeling options for waste destinations, such as building new sanitary landfills with GCCS and sending all future waste there.
Exhibit 3. Methane mitigation potential of Rio’s food loss and waste prevention goal as estimated using WasteMAP’s CDST in June 2025 (the dark blue curve shows the food loss and waste reduction scenario, the light blue panel is for business as usual).
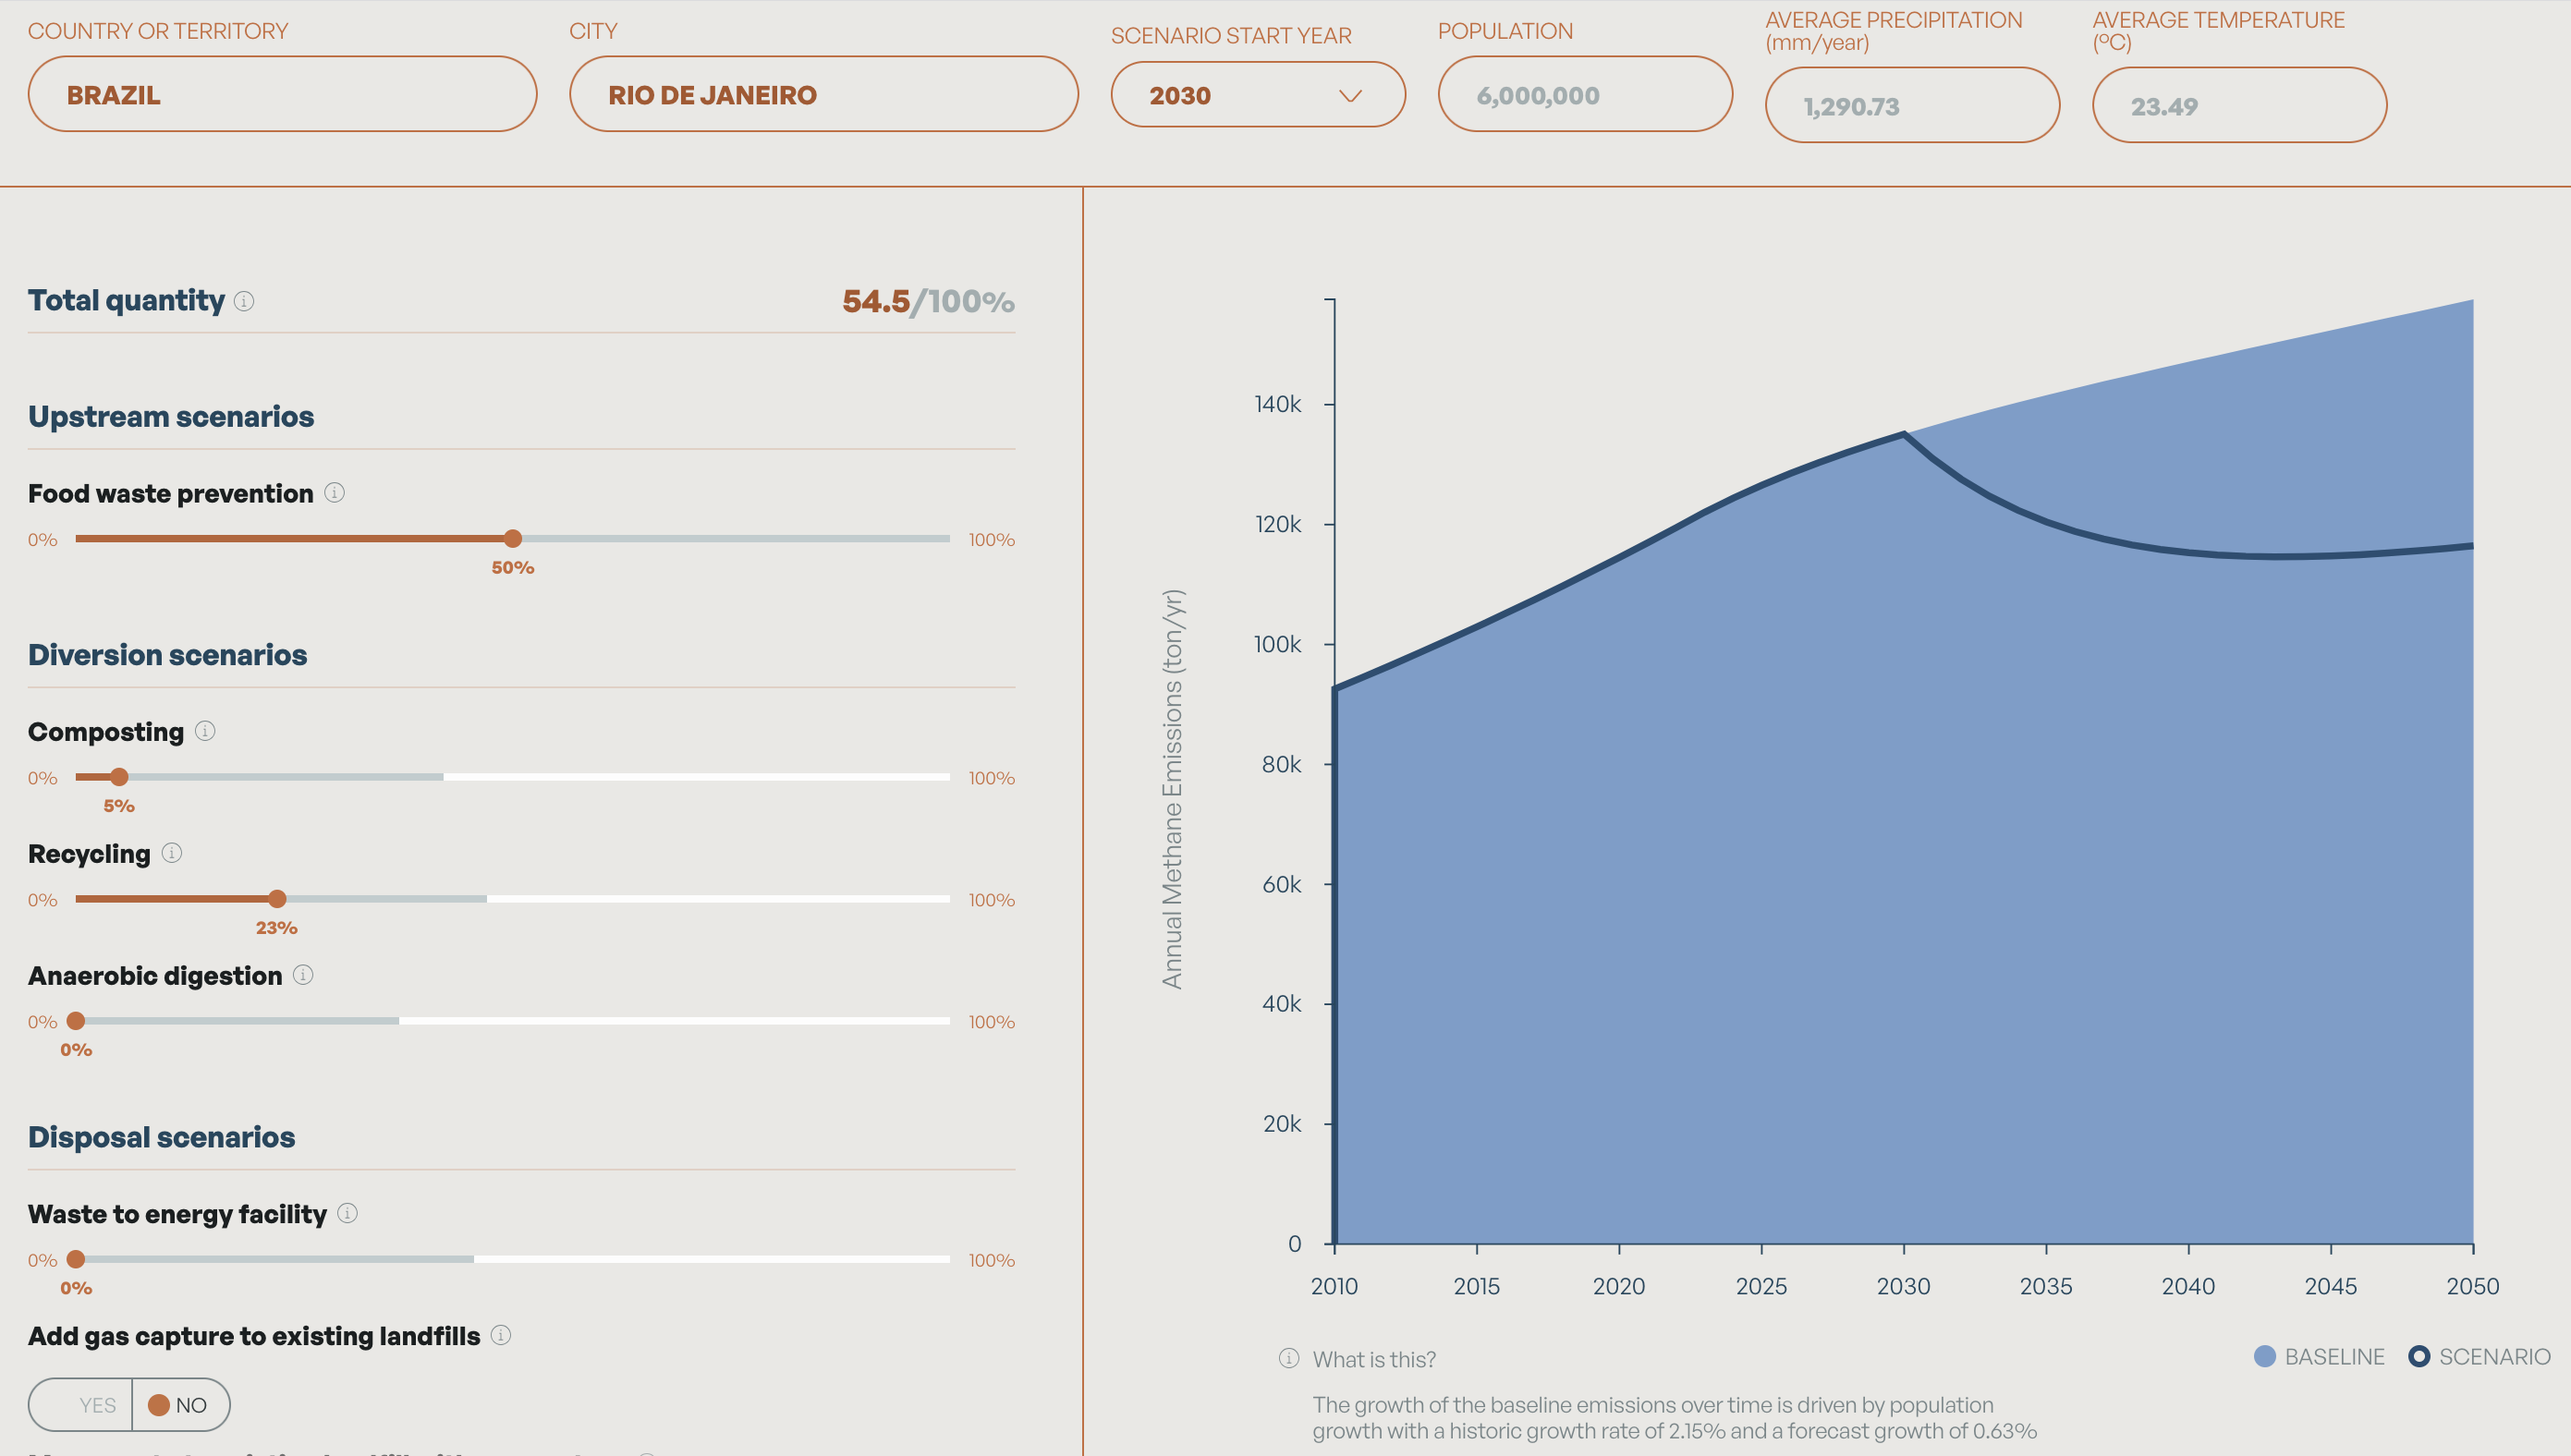
Source: WasteMAP CDST, captured June 2025
- More satellite data becoming available on WasteMAP
We’ve enhanced WasteMAP’s interactive map layers to label all sites with satellite or aerial flyover observations using a different color and symbol (Exhibit 4). This makes it easier for users to access and explore observational data available on WasteMAP, as a first step to comparing observed emissions with modeled results. As of end of June 2025, the platform includes over 3,000 methane plumes attributed to disposal sites from the following instruments: GHGSat, provided through SRON’s Targeting Waste Emissions Observed from Space (TWOS) initiative, NASA’s EMIT satellite and Carbon Mapper’s air borne campaigns, streamed via Carbon Mapper’s Open Data Portal, and EnMAP satellite obtained from UNEP’s International Methane Emissions Observatory.
Exhibit 4. Sites with satellite and flyover observations are marked with darker orange and a satellite symbol.
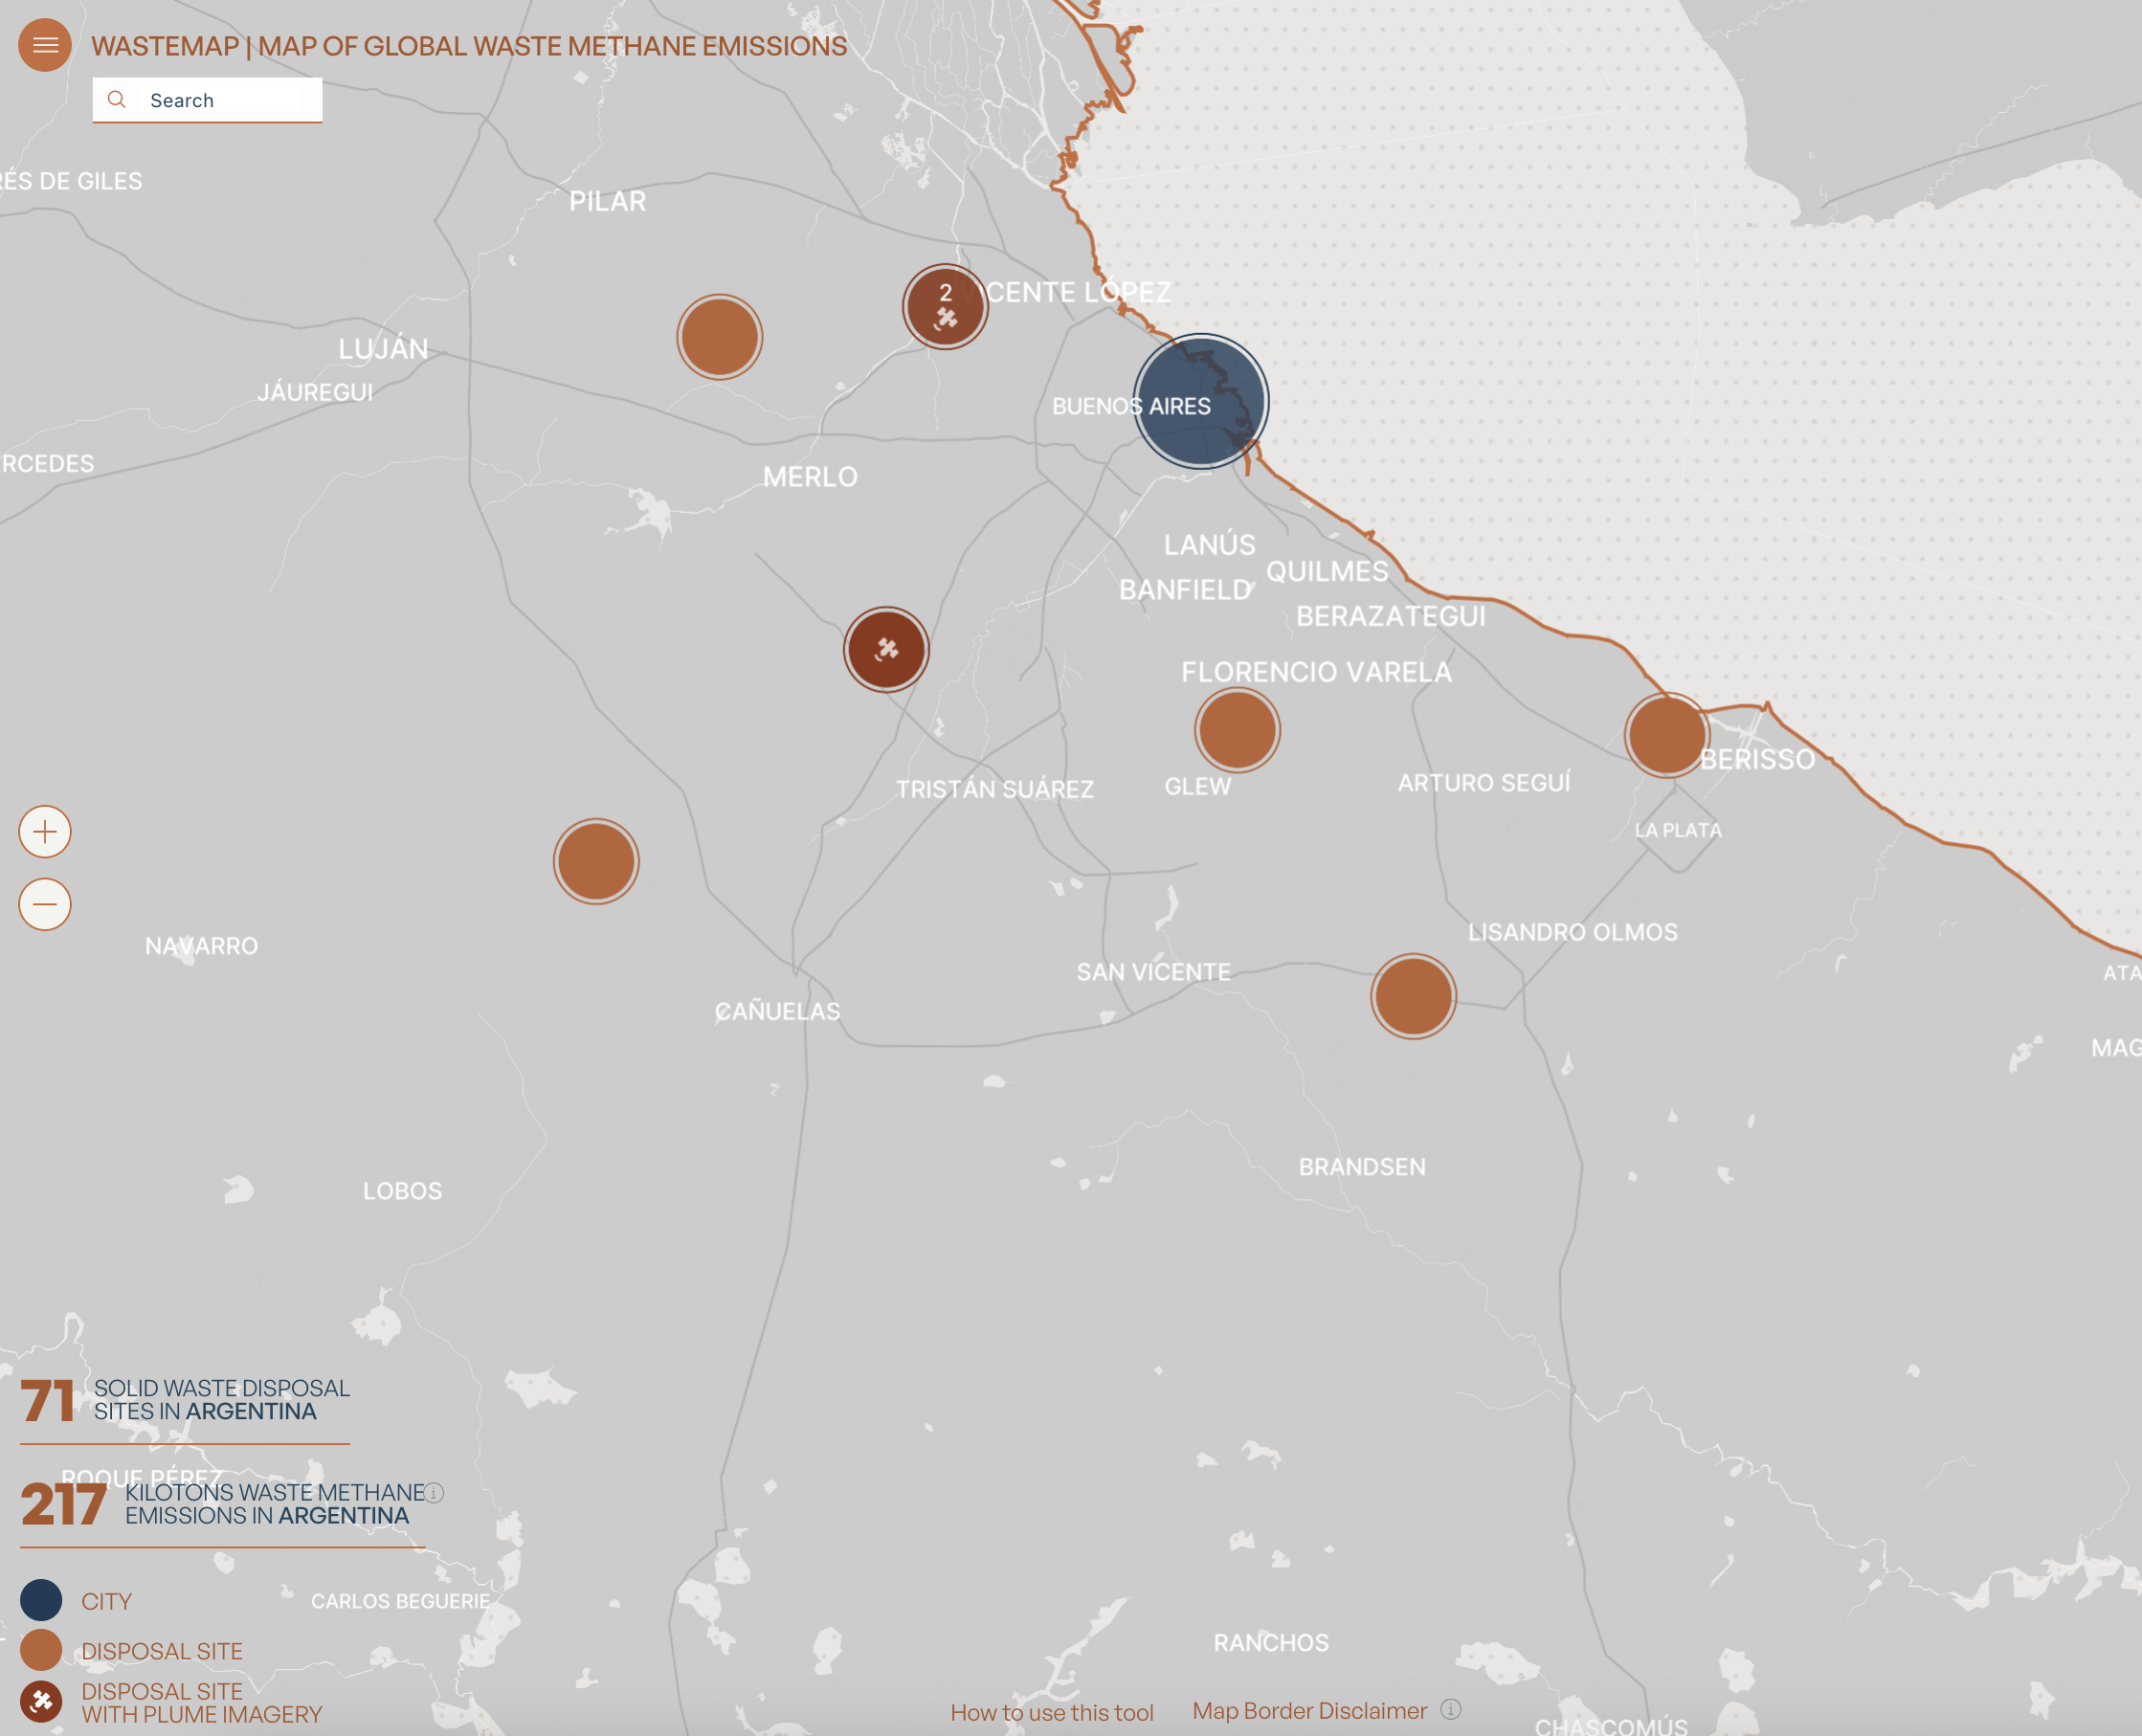
Source: WasteMAP, captured June 2025
Why this matters and what’s next
These new features mark a significant step toward localized, actionable methane mitigation in the waste sector. While full integration of satellite and other observational data into modeled emissions estimates is still in progress, the new SDST and a comprehensive observational data ingestion process bring us closer to that goal.
By combining “bottom-up” estimates (from site waste data) with top-down measurements from drones, satellites, or other platforms, WasteMAP aims to become a comprehensive waste methane emissions intelligence platform that can support:
- City and site-level methane mitigation planning
- State waste methane mitigation policy making
- Enhancement of national inventories and NDC planning processes
- Methane emissions evaluation for infrastructure investment portfolios and programmatic MRV for multilateral development banks
- Portfolio emission estimation for climate-aligned waste management companies
In the coming months, RMI’s WasteMAP team will lead updates to the Climate TRACE solid waste sector emissions data and release new site-level emissions estimates as part of the broader Climate TRACE coalition. We are also continuing our involvement in the LOW-M initiative, supporting jurisdictions on waste sector methane mitigation planning. With continued support from funders and partners, we are committed to delivering WasteMAP’s decision-support tools to the policymakers, financiers, and practitioners best positioned to drive meaningful, on-the-ground impact. We’re grateful to our collaborators at Earth Genome for their frontend development contributions that helped bring this feature release to life.
Join the Conversation
We invite you to join our upcoming webinar, where we’ll demo the new tools and hear from leading voices across waste, methane, data, philanthropy, and development finance. Speakers include representatives from RMI, Global Methane Hub, Carbon Mapper, and the Inter-American Development Bank.
➡️ Register for the July 10 webinar here
Help us turn methane data into climate action.
This article was informed by the contributions of Ebun Ayandele, Dr. Bram Maasakkers (SRON), Vera Vinson, Colm Quinn, Amanda Sessler. It would not have been possible without the generous support of Global Methane Hub and Google.org.
